
If you have rights to use statistics you can access the feature in the Admin portal by clicking Statistics on the left-hand side of the page. In the new view, you have two options to choose from: Show statistics and Generate report.
Show statistics
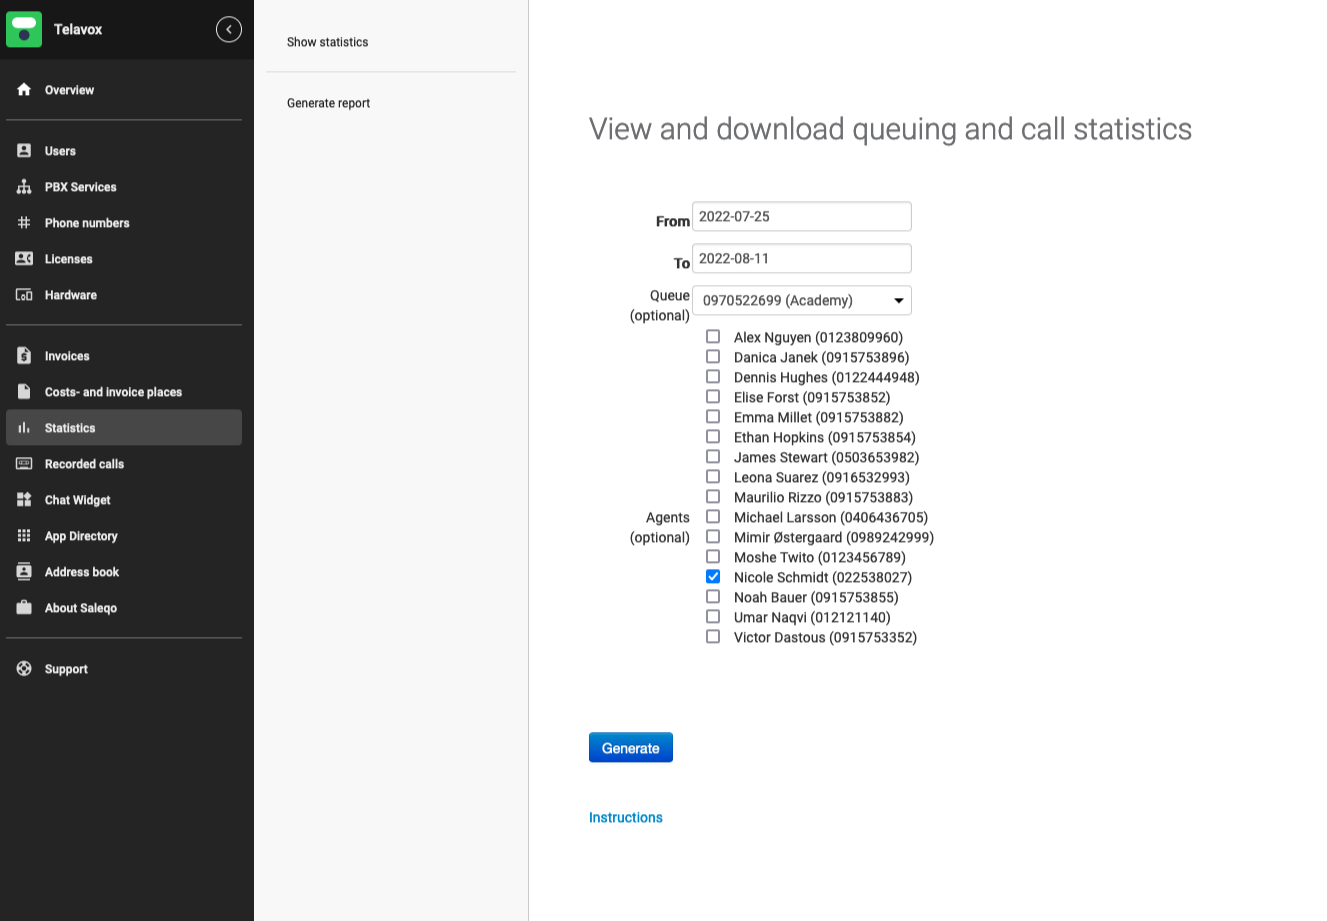
You are automatically redirected to the tab Show statistics. Here you can view and download call statistics of a certain queue or users. Just simply select the time range you want to see, as well as the queues or users, then click Generate.
Then the system will notify you that the information is being gathered, and once that is done, you will be redirected to a view where you can see Amount analysis, Time analysis or then Export queue data (here you can download either CSV or Excel files of the retrieved data). You can also click on Instructions to read more about the statistics.
You cannot generate statistics further than 2 years back, you also cannot choose a timespan that is longer than 3 months (From and To date).
Generate report
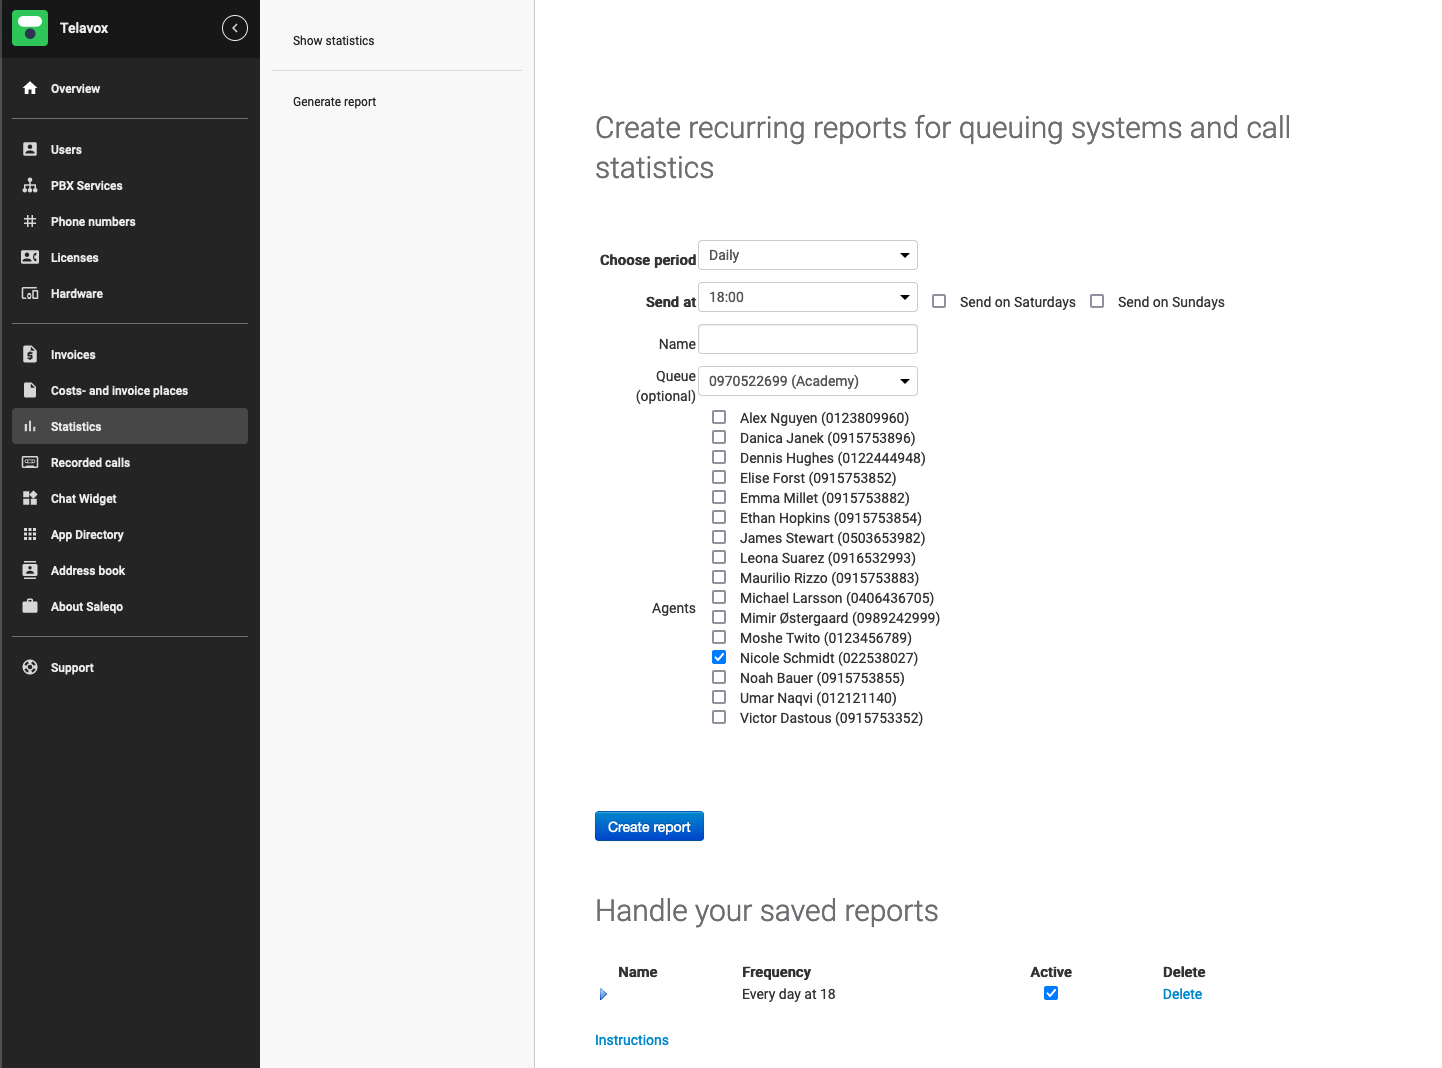
Here you can select to generate automated reports similar to the ones you can get from Show statistics. These reports are recurring according to your wishes – so simply select the attributes for the reports and click Create report. Once done, you will see the created report in the view at the bottom of the page under Handle your saved reports. Here you can manage the reports you have saved, for example by deactivating or delete them.
If you were to download the statistics as Excel or look at the graph and filter on agents, the agents would be specified with their landline number and not their name or mobile number. This also means that the statistics will not reflect if incoming calls came in on the landline or mobile number of a user.
DeleteExport statistics
When you generate a report, you get a graphical overview about the calls presented in your report. It could look something like this:

Under Amount analysis and Time analysis, you have the same kind of information available, but with the difference that Amount analysis show you the amount of calls per hour, and Time analysis the duration of calls per hour. You also have different metrics you can choose to include in the graph, such as...
- Incoming calls for queue - this means all incoming calls which were made to a queue
- Incoming direct calls - this means all incoming calls which were made directly to an agent
- Outgoing direct calls - this means all outgoing calls which an agent made
- Agents logged in duration - this includes all agents which were logged into the queue in question
- Include mornings and evenings(0-8&18-24) - this means that you can include the said hours in the report
If you add or remove members from a queue, you need to delete the generated report and recreate it. The report itself will not update automatically.
How to read the excel export
Once you have taken out a report - you get an excel sheet with two tabs. The first tab is called Information, and contains information on how to read the export. The second tab is called Data and contains the actual data. We highly recommend going through the instructions in the Information tab. Below you can see an example of how an export can look in the Data tab:

If you look at the columns in the above picture:
- Date is for the date of the call taking place
- Time is the exact time of the call taking place
- Caller number contains the number the call was called from
- Termination/Status contains actual data regarding the call's status, as well as data regarding other events like queue logins or logouts (all these are explained in the export in the Information tab)
- Queuing time shows the amount of seconds the caller was in queue before the call was either answered or hung up
- Processing time shows the actual duration of the call in seconds
- Answerer's number shows the agent's number who picked up the call
- Forwarding number shows the number where a call was forwarded (if used)
If a row contains e.g. a queue login, you will not see a phone number but only the action that took place. In the picture above the row with AGENTLOGOUT and AGENTLOGIN show the exact timestamps when a use logged into a queue.